This section covers the resource details. (Remember that we assigned one participant to the "working" activities.)
Resource Usage
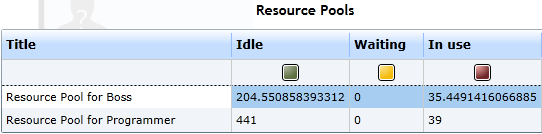
The first table in this section illustrates the resources' utilization. A resource can be set (by the simulation) to four different states (See chapter Resources from the Simulation Tutorial for more information):
- Idle: The resource is idle.
- Waiting: The resource is waiting. E. g. if an activity requires one Programmer and one Boss resource, it might get the Boss, but will possibly have to wait for a programmer. This "waiting" time will be added to the Boss' "Waiting time" after the programmer is finally available.
- In use: The resource is being used by any activity.
- Other Role: The time a resource spent in another role. E. g. when resources are assigned more than one role.
- Setup time: The time a resource spent in the setup status.
- Post-processing time: The time a resource spent in the post-processing time.
- Basic Load: The time a resource spent in the basic load status.
The values in the table are the cumulated status-time values of each resource. You might wonder why the cumulated time (waiting + in use) is 240 for the boss and 480 for the programmer. This is due to the fact that we defined two programmers in our organization diagram (see here).
- As you can see the boss is idle for 205 hours and in use for 35 hours.
- The programmer is idle for 441 hours and in use for 39 hours.
- Due to the model parameters the waiting time is always 0.
- Our resources do not have to wait for other resources, because we did not specify combined resource usage at any activity.
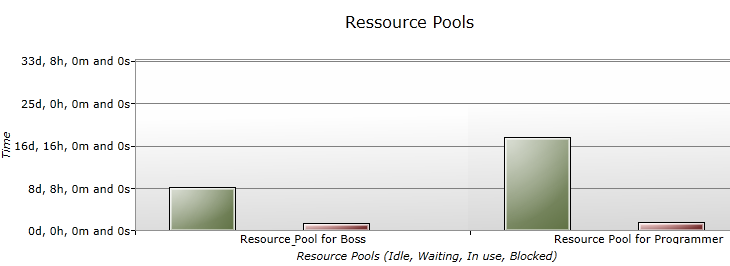
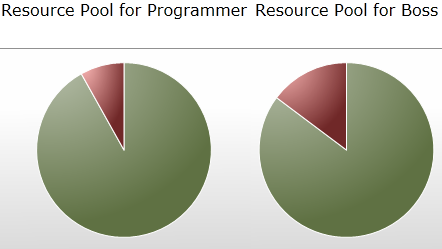
- The Figures 2 and 3 (bar chart and pie chart) map these values graphically.
|
Figure 1: Resource Pools statistic
|
|
Figure 2: Histogram for the resource usage
|
|
Figure 3: Pie charts for the resource usage
|
Queue statistics
- Finally you can find a table in Figure 4 with the statistics for the queues,
- which are used at each resource pool.
- Each token that arrives at an activity (which requires a resource) inserts itself into the queue at the resource pool of which it needs one or more resource(s).
- The queues are always set to First In First Out (FIFO) order.
- In this simple example we do not have any waiting time for a resource.
- But if you change the inter-arrival time of our model's start event to constantly one hour, you will get some significant changes in this table's values. Just try it out.

|
Figure 4: Queue statistics of the report's Resource Details
|