See below for the run configuration, which we set up to receive the report statistics from below.
Please refer to the section Experiment Results for more information on the report specific data.
Run configuration
- Stochastic Seed: 12345
- Simulation start date: 1/1/2014 12:00:00 a.m.
- Simulation stop time: 240
- Simulation stop time unit: Hours
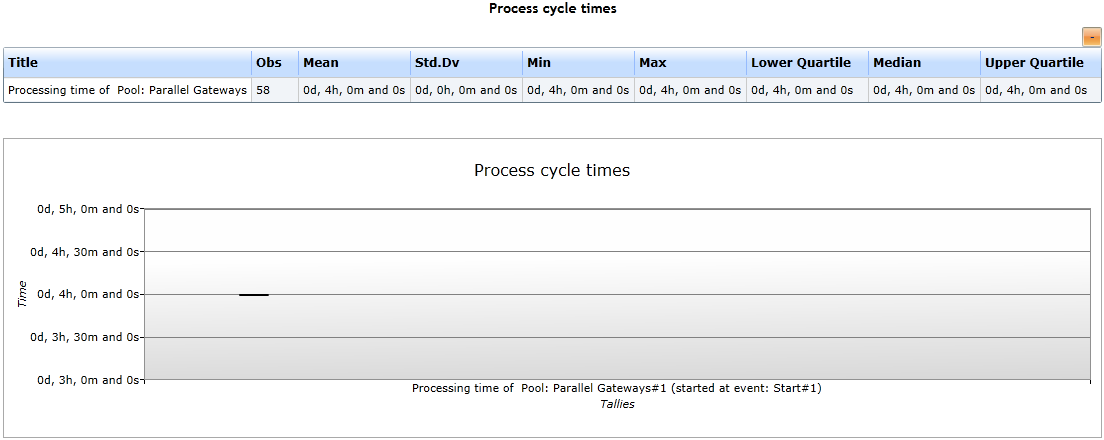
Report statistics
- As you might notice, the process cycle time is always 4 hours
- There is no standard deviation because we set up constant durations for both activities
- And as mentioned before, this model's process cycle time depends on the activity with the longest duration
- The merging parallel gateway has to wait for all sequence flows to arrive
- That is why the process cycle time is always 4 hours, which is the top activity's duration
- Also note: The box-plot from Figure 1 below is nearly invisible.
- It is reduced to a simple line, because all the statistics are equal (Min-, Max-value, etc.)
|
Figure 1: Process cycle times of Model 2
|