When the simulation has finished, you will get a report with a set of values for your experiment. See below for the run configuration, which we set up to receive the report statistics from below.
Please refer to the section Experiment Results for more information on the report specific data.
Run configuration
- Stochastic Seed: 12345
- Simulation start date: 1/1/2014 12:00:00 a.m.
- Simulation stop time: 48
- Simulation stop time unit: Hours
Report statistics
The report of this model consists of three parts:
- Process details
- Activity details
- Event details
Note
Actually the report consists of four parts. The first part contains the model description and the settings of the experiment run. This enables you to reproduce the report by reconfigure the simulation with the given information.
Process details
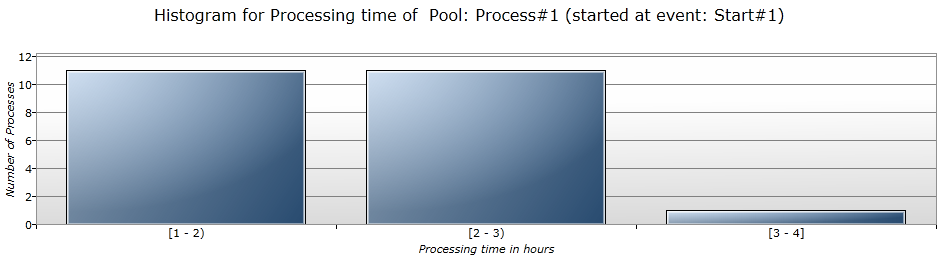
Here the report provides statistics for the processes' cycle times. They are visualized by histograms (Figure 1) and Box-plots (Figure 3). But there are also tables with the exact statistics (Figures 2 and 4).
|
Figure 1: Histogram of the process' processing time
|
Result
- The process cycle times from figure 2 deliver the statistics for the process' cycle time
- We notice, that the cycle time's mean value is at around 2 hours and 2 minutes
- with a standard deviation of about 29 minutes
- The lowest cycle time amounts to 1 hour and 6 minutes (Min-Value)
- The highest cycle time amounts to 3 hours and 9 minutes (Max-Value)
- This is also represented in the histogram
- There is only one process instance whose cycle time was higher than 3 hours
- The histogram classifies the finished process instances into time intervals
- As you see, 22 process instances have a cycle time between 1 and 3 hours
- There is only one outlier
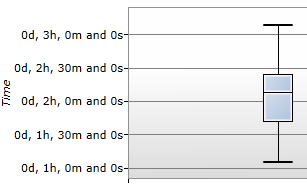
- Additionally the box-plot from figure 3 tells us that the process instances' cycle times concentrate in a range between 1 hours and 30 minutes and 2 hours and 30 minutes
- Also see the last 3 columns of the table from Figure 2 (Lower and upper quartile and median).
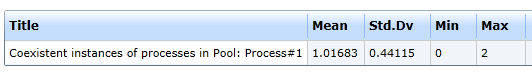
- The table from Figure 4 illustrates statistics about the number of simultaneously active process instances.
- On average there was only one process instance active (Mean)
- There have been at most 2 process instances active at the same time (Max)

|
Figure 2: The process' cycle time statistics
|
|
|
Figure 3: Box-plot visualization of the process' cycle times
|
Figure 4: The concurrently active process instances
|
Activity details
In this part of the report you will find all the statistics of the activities.
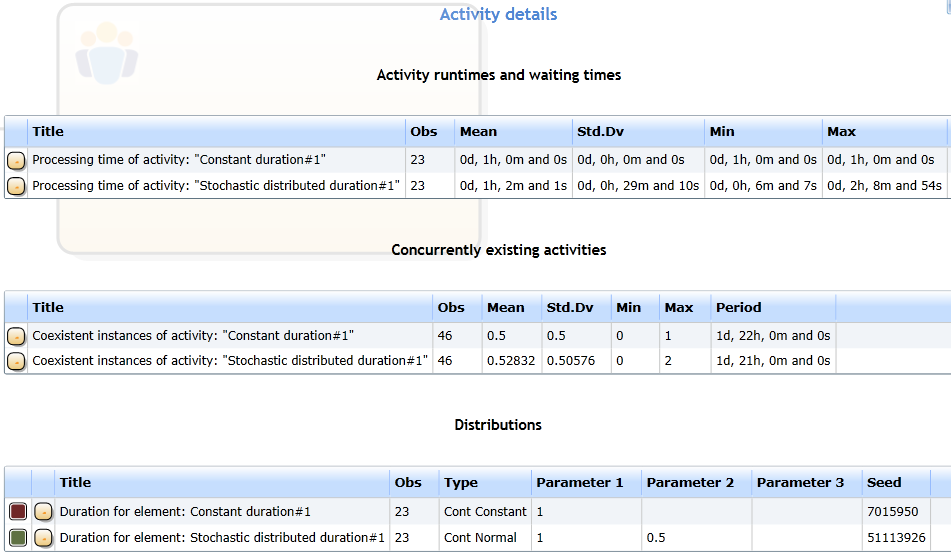
Activity run-times and waiting times
- We notice that "Constant duration" activity really was constant (1st line of the activity run-times and waiting times table from figure 5)
- Check out the "Stochastic distributed duration". It almost reaches our configuration of a normal distribution with a mean value of 1 and standard deviation of 0.5
- Note that, the longer the simulation runs the more this statistic will converge to our actually set normal distribution
- Do you notice something else?
- Yes, if you add up both activities' mean value you will get the process' mean cycle time as a result
- The same goes for the standard deviation, minimum and maximum values
- Unfortunately this only that simple, because our model is also very simple
Concurrently existing activities
- We notice that there has been 0.5 activities of "Constant duration" active at the same time
- How is this even possible? You cannot have half an activity active!?
- These values are still just statistics for a certain period of time
- Explanation
- Our process starts every 2 hours
- The "Constant duration" activity works constantly for 1 hour
- So, there is a difference of 1 hour
- The constant activity finishes and the next process instance starts after 1 hour and will therefore reach the constant activity in 1 hour
- That is why - in statistical matters - this activity is only active half of the time
- The same explanation applies for the stochastic activity
|
Figure 5: The report's activity details
|
Distributions
- The Distributions table from Figure 5 simply shows the Distributions' configurations, which we set
- Also you can find the number of value drawings from the distribution (Obs)
- And its individual seed is also depicted in the table
- Note that this seed depends on the general seed
Event details
This part of the report presents the events' statistics, see Figure 6.
Event counter
- In this table you can see how often an event has been executed (Obs)
- The end event of our process has been executed 23 times, which matches the number of finished process instances in the process details
Inter-arrival times
- This table shows the inter-arrival times of events
- This means, we count the time between the execution of the same event and then erect this statistic
- Our start event has an inter-arrival time of 2 hours
- This matches with our configuration for the start event (Constant distribution with a value of 2)
- Our end event's inter-arrival time has a mean value of 1 hour and 58 minutes
- Please do not confuse yourself by thinking that the end event's inter-arrival time should be the same as the process' cycle time
- These times' values are similar to each other, but they are mostly not equal
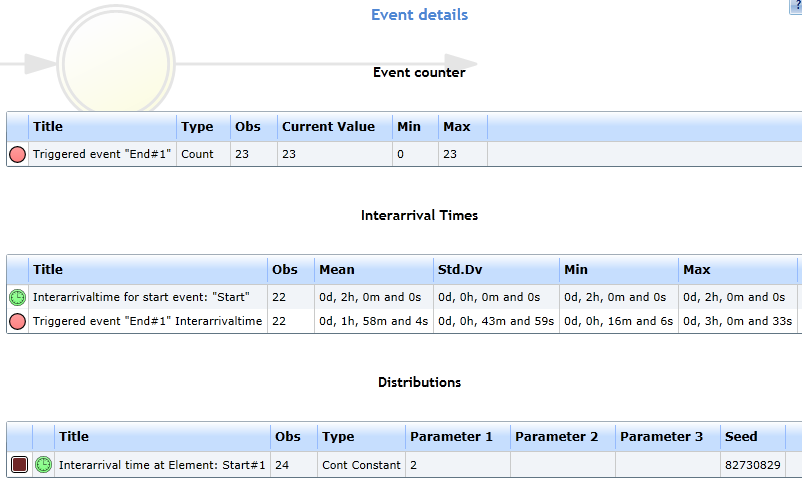
|
Figure 6: The report's event details
|