See below for the run configuration, which we set up to receive the report statistics from below.
Please refer to the section Experiment Results for more information on the report specific data.
Run configuration
- Stochastic Seed: 12345
- Simulation start date: 1/1/2014 12:00:00 a.m.
- Simulation stop time: 240
- Simulation stop time unit: Hours
Report statistics
|
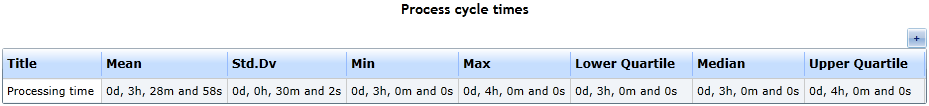
Figure 1: The processing times
|
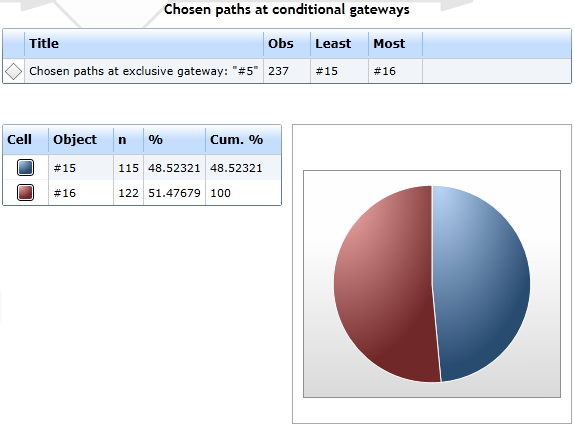
- First have a look at the gateway details from figure 4
- Our gateway fired the top sequence flow leading to the error sending end event 115 times
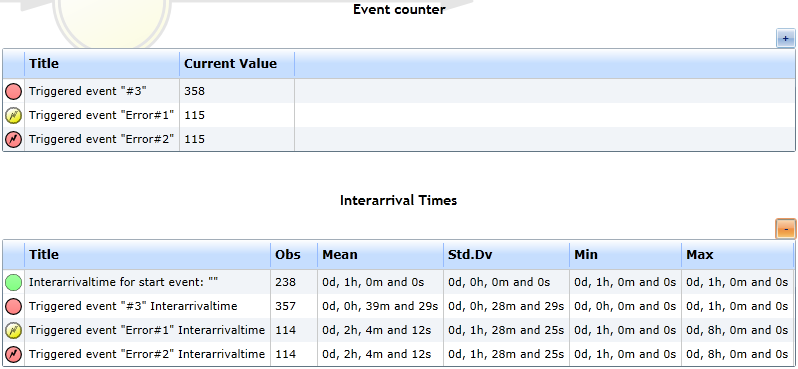
- Which means that "Task 3" has been interrupted 115 times (take a look at the event counter from figure 3)
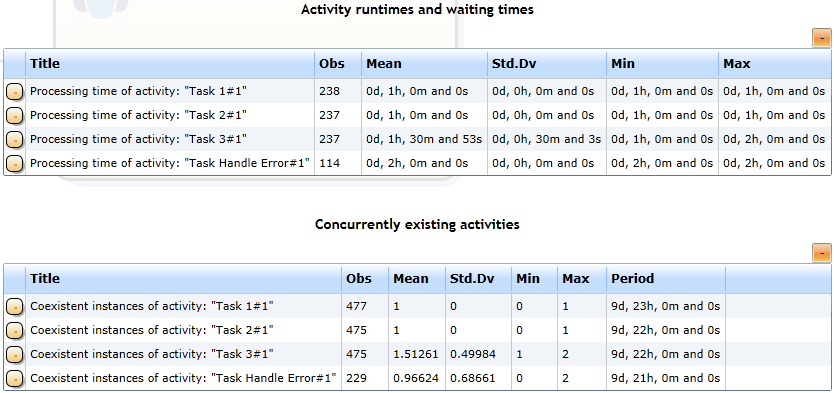
- So, the task "Task Handle Error" has also been reached 115 times (it was only completed 114 times, figure 2)
- The fact, that the "Task Handle Error" is being executed, has an impact on the process cycle time (see figure 1)
|
Figure 2: The report's activity details
|
|
Figure 3: The report's event details
|
|
Figure 4: The report's gateway details
|