See below for the run configuration, which we set up to receive the report statistics from below.
Please refer to the section Experiment Results for more information on the report specific data.
Run configuration
- Stochastic Seed: 12345
- Simulation start date: 1/1/2014 12:00:00 a.m.
- Simulation stop time: 240
- Simulation stop time unit: Hours
Report statistics
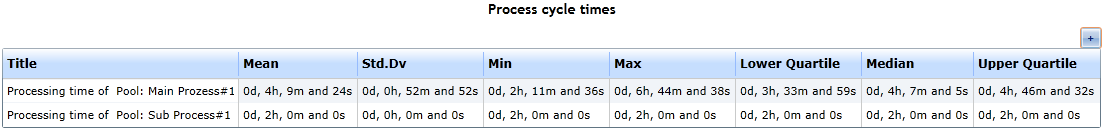
- The report's process cycle times (figure 1) contain two processing times
- The one for the main process
- The one for the subprocess (which is being executed in the first task)
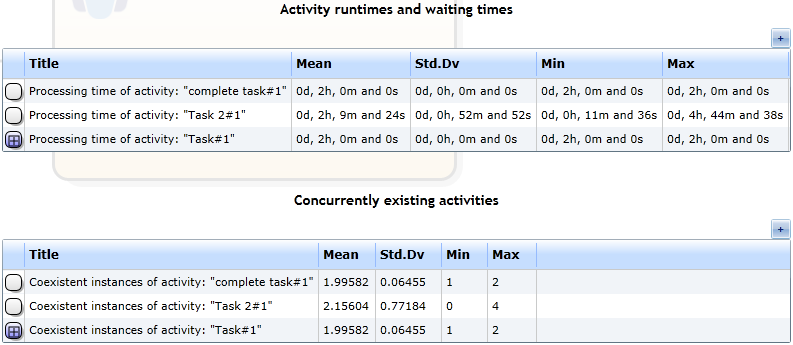
- Note that the statistics from "Task 1" (Figure 2 - activity run-times) and those from the subprocess (lead time) are equal
- Since the subprocess is executed within the activity, this must be the case
|
Figure 1: The processing times
|
|
Figure 2: The report's activity details
|