Process run-times
The first section of the report (after the model description) deals with the general statistics of the process(es). The information gives you an overview of the process(es)' lead time(s), which are visually enhanced by histograms or box-plots.
Histogram
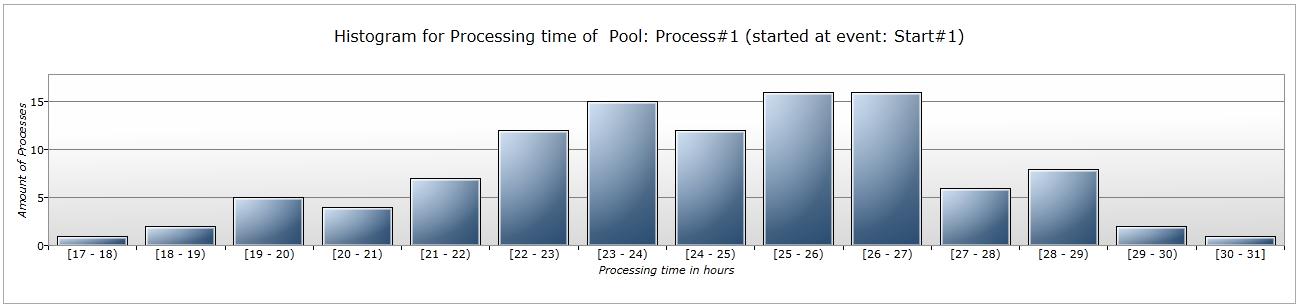
The first figure in the process details depicts a histogram for the processing time of one of the processes (in this case each pool is a process). It simply shows the amount of process instances (Y-axis), which finished in a certain interval (X-axis).
|
Figure 1: Report: Process details - Histogram for the processing time |
Figure 2 below shows the statistics for the process(es)' lead time(s).
See the extra table for more information on the statistical elements.
|
Figure 2: Report: Process details - Process run-times (in table representation) |
Process runtimes (see table above and the box-plot below) |
|
Title |
Name of the process. |
Obs |
The number of finished process instances. |
Mean |
The mean value of the process' lead time. |
Std.Dv |
The standard deviation of the process' lead time. |
Min |
The minimum value of the process' lead time. |
Max |
The maximum value of the process' lead time. |
Lower Quartile |
The lower quartile of the process' lead time. |
Median |
The median of the process' lead time. |
Upper Quartile |
The upper quartile of the process' lead time. |
Box-Plot for the process run-times
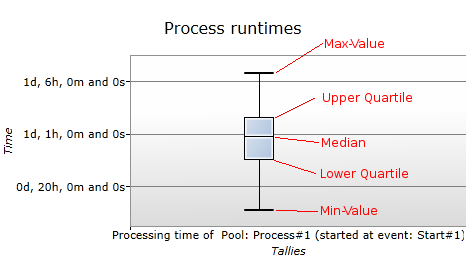
Additionally to the histogram we provide a box plot that represents the table above (Process runtimes). Notice that the cluster we discovered in the histogram is also illustrated within this box plot (the range from lower quartile to upper quartile).
|
Report: Process details - Process run-times (in Box-Plot presentation) |
Concurrently existing processes
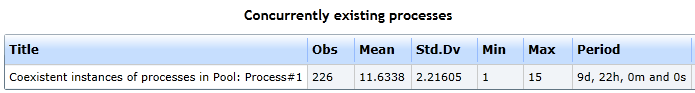
Finally, there is a further statistic table, that reveals the concurrently existing instances of a specific process.
We learn that there approximately 12 process instances of our model have been active at the same time.
|
Report: Process details - Concurrently existing processes |
Concurrently existing processes (see table above) |
|
Title |
Name of the process |
Obs |
The number of started activity instances. |
Mean |
The mean value of the concurrently existing process instances. In this case there were 11.6338 process instances active on average. |
Std.Dv |
The standard deviation of the concurrently existing process instances. |
Min |
The minimum value of the concurrently existing process instances. In this case there was at least one process instance active throughout the simulation. |
Max |
The maximum value of the process' lead time. In this case there were at most 15 process instances active throughout the simulation. |
Period |
The period in which the process instances occurred. Note that we set the simulation stop time to 240 hours, which are ten days actually. Hint: The difference of two hours between that and the period information originates in the fact that we set the process' inter-arrival time (start event) to constantly two hours. |
Going deeper