This section of the report deals with activity details. These statistics are part of the process' local dynamics, whose understanding has a crucial impact on the comprehension and improvement of the entire process.
Concurrently existing activities
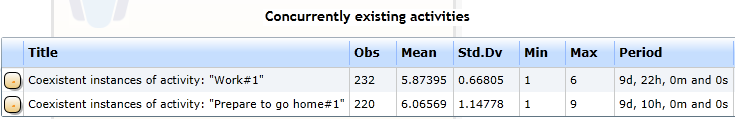
The table from Figure 1 depicts the concurrently existing activities. We learn that there have been approximately 6 instances of each of the activities active at the same time.
|
Figure 1: Report: Activity details - Concurrently existing activities |
Run-times and waiting times
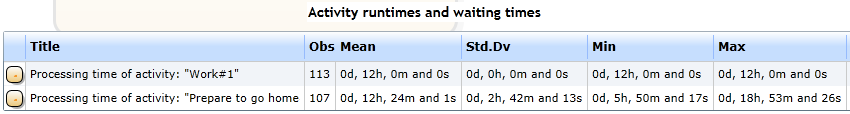
Figure 2 shows the activity run-times and the waiting times of activities.
Hint
Explanation
|
Figure 2: Report: Activity details - Activity run-times and waiting times |
Distributions
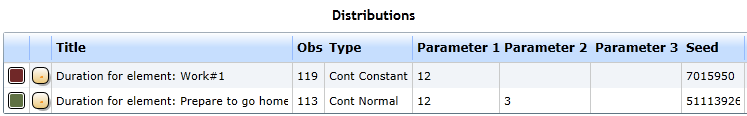
Finally the table from Figure 3 shows the activities' distribution statistics.
In this case we get statistics for the two distributions we have specified in the model (constant distribution and Normal distribution).
Note
|
Figure 3: Report: Activity details - Distribution statistics |
Distributions (see table above) |
|
Title |
Name of the process |
Obs |
The number of started process instances. |
Type |
An abbreviated denomination of the distribution's type. E. g. Cont Normal for the Normal distribution |
Parameter 1* |
The value for the distribution's first parameter. |
Parameter 2* |
The value for the distribution's second parameter. |
Parameter 3* |
The value for the distribution's third parameter. |
Seed |
The distribution's seed value. |
Also note
The amount of parameters changes depending on the distribution type. E. g. the normal distribution needs two parameters, the Constant distribution though needs only one.