See below for the run configuration, which we set up to receive the report statistics from below.
Please refer to the section Experiment Results for more information on the report specific data.
Run configuration
- Stochastic Seed: 12345
- Simulation start date: 1/1/2014 12:00:00 a.m.
- Simulation stop time: 240
- Simulation stop time unit: Hours
Report statistics
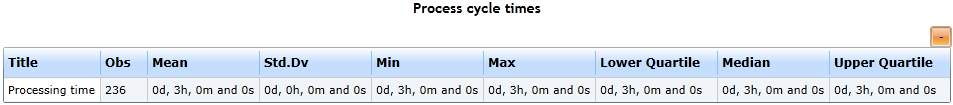
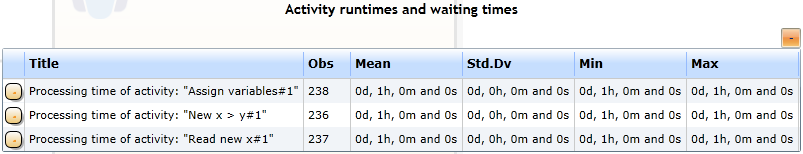
- The process cycle times and the activity run-rimes (Figures 1 and 2) show us that the variable x indeed is bigger than y
- Also if you take a look at the gateway details (not listed here), you will notice that always the same edge has been followed behind the branching exclusive gateway
- Retrospective: x = 3, y = 4
- But at the second activity we assigned x the value from the data object, which is 5
- 236 process instances have been completed throughout the simulation
- The number of completed "New x > y" also equals 236
- These numbers tell us that x is always greater than y (which is not really surprising, because we defined it that way)
|
Figure 1: The report's process cycle time
|
|
Figure 2: The report's activity run-times
|