See below for the run configuration, which we set up to receive the report statistics from below.
Please refer to the section Experiment Results for more information on the report specific data.
Run configuration
- Stochastic Seed: 12345
- Simulation start date: 1/1/2014 12:00:00 a.m.
- Simulation stop time: 240
- Simulation stop time unit: Hours
Report statistics
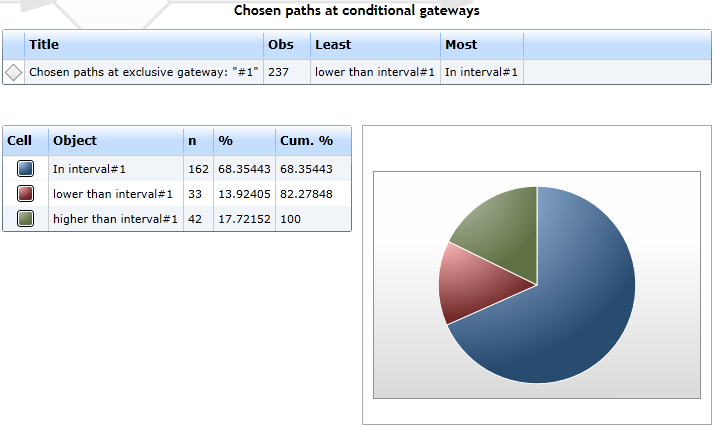
- This report contains a beautiful pie chart, which almost resembles the stochastic correlations of the normal distribution, which are:
- In 70% of cases the value is within the assigned interval (mean +/- the standard deviation)
- in 15% of cases the value is below the assigned interval
- in 15% of cases the value is above the assigned interval
- You can verify this by extending the simulation's run-time significantly
- The percentages should converge to 70, 15 and 15
- In the second table you can find the statistics in numbers, which also resemble the facts from above
|
Figure 1: The report's gateway details
|