See below for the run configuration, which we set up to receive the report statistics from below.
Please refer to the section Experiment Results for more information on the report specific data.
Run configuration
- Stochastic Seed: 12345
- Simulation start date: 1/1/2014 12:00:00 a.m.
- Simulation stop time: 240
- Simulation stop time unit: Hours
Report statistics
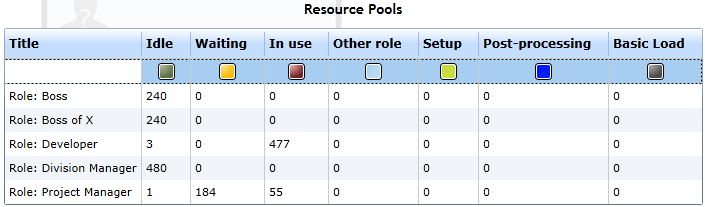
- Figure 1 shows us that both developers have been in use (almost) throughout the whole simulation. (The 3 hours of idle time result from the specifics of the start events' inter-arrival times).
- In contrary, the Project Manager has been in use for only 55 hours and was waiting for one of the Developers for 184 hours. Remember that the activity Develop (internal) requires one Project Manager and one Developer.
|
Figure 1: Resource statistics for Developer and Project Manager
|
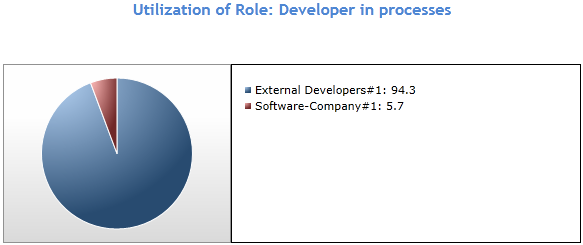
- Let's take a look at Figure 2, which shows the utilization of the Developer role
- We learn that the pool External Developers has been acquiring both developers' working time for 94.30 % throughout the simulation. The Pool Software-Company got only 5.7 % of their working time.
|
Figure 2: Utilization of the Developer role
|
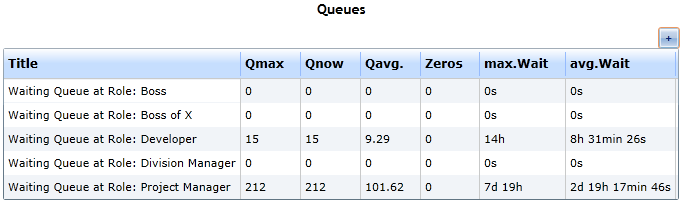
- Figure 3 depicts the queue statistics for the processes waiting for either one of the Developers or the Project Manager
- Due to the fact, that the Project Manager is being held up at activity Develop (internal), all the process instances arriving at activity Planning Workload must wait disproportionately high.
|
Figure 3: Queue-Statistics for the Developer and Project Manager
|
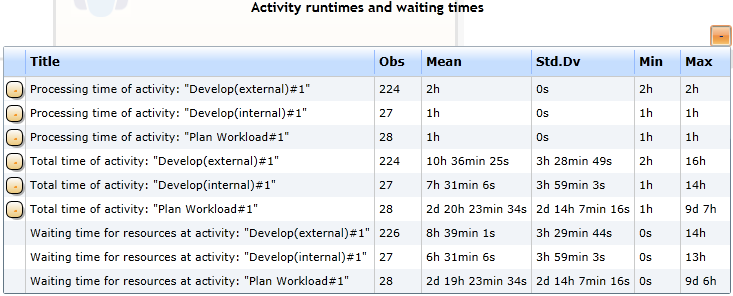
- From figure 4 (Activity Runtimes) we learn that this is exactly the case
- The Project Manager finished the activity Plan Workload (executed 28 times [Obs]).
- But the activity Develop(internal) has been executed only 27 times.
- So the Project Manager is currently held at Develop(internal)
- See this chapter's subpage Prioritization of Resources for more information on this matter
|
Figure 1: Activity Runtimes
|
Explore
- Try to explore Model 14's dynamics by adding an additional Developer to the Organization Diagram.
- On first thought, this measure should decrease the Project Manager's waiting time for a Developer and consequently the waiting processes in the queues and the processes' lead times.
- Right? Try it! You will be surprised! Please try to understand on yourself, what happens there by adding another Developer.
- You can, add another Project Manager to improve your understanding of the model's dynamics.