See below for the run configuration, which we set up to receive the report statistics from below.
Please refer to the section Experiment Results for more information on the report specific data.
Run configuration
- Stochastic Seed: 12345
- Simulation start date: 1/1/2014 12:00:00 a.m.
- Simulation stop time: 240
- Simulation stop time unit: Hours
Report statistics
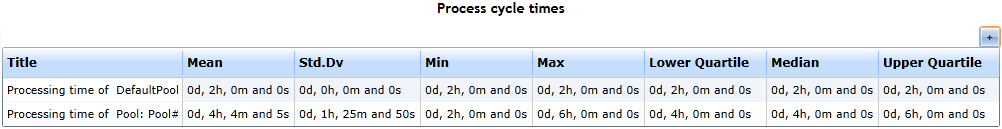
- In figure 1 you find the process cycle times for the main process and the subprocess that is being executed in the subprocess activity "Sub Process"
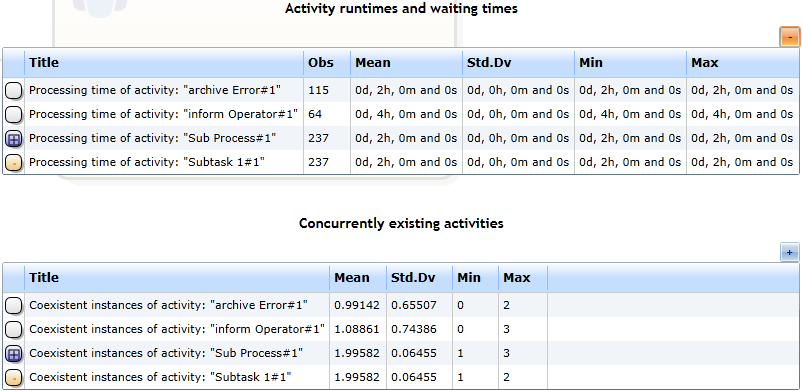
- Note that the subprocess' cycle times are identical to the run-times of the subprocess activity (figure 2)
|
Figure 1: The processing times
|
|
Figure 2: The report's activity details
|
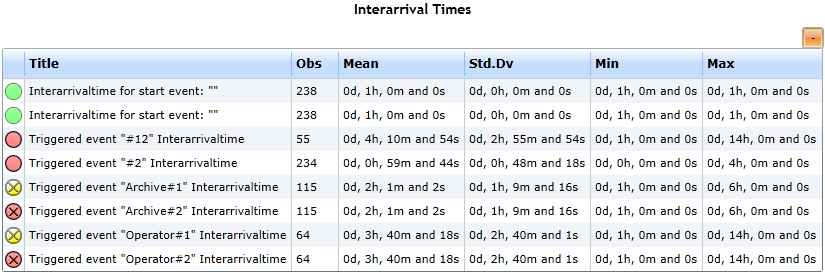
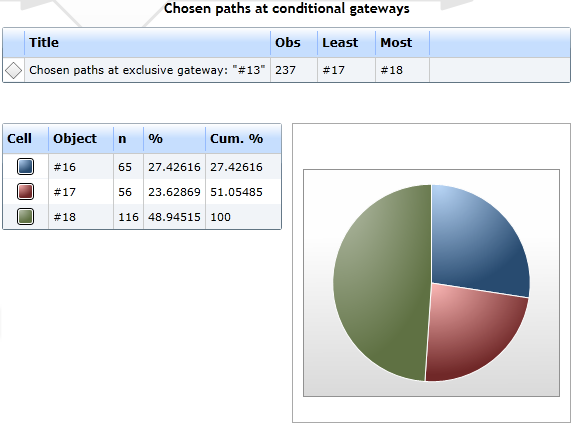
- Figure 3 shows the event details, which can directly be linked to the gateway details from figure 4
- Due to our configuration of the subprocess' gateway depending on the stochastic variable x,
- the sending cancel end event "Archive" has been executed most times
- the default end event and the second cancel end event have been executed nearly similar ("#12" with 56 times, and "Operator#2" with 65 times)
|
Figure 3: The report's event details
|
|
Figure 4: The report's gateway details
|