See below for the run configuration, which we set up to receive the report statistics from below.
Please refer to the section Experiment Results for more information on the report specific data.
Run configuration
- Stochastic Seed: 12345
- Simulation start date: 1/1/2014 12:00:00 a.m.
- Simulation stop time: 240
- Simulation stop time unit: Hours
Report statistics
- This fairly simple model introduces you to the concept of message exchange between pools
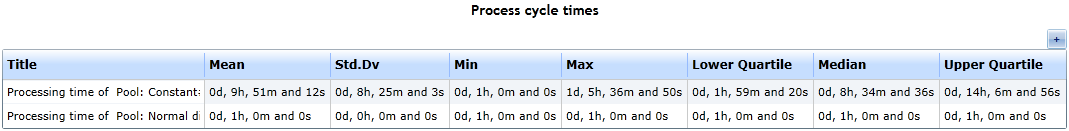
- Actually, both processes in the model should be completed in 1 hour
- Remember that we set up constant distribution with a value of 1 for both tasks' duration
- This is true for the top pool, which sends the message
- But the bottom pool comes with a very big processing time
- How is that even possible?
|
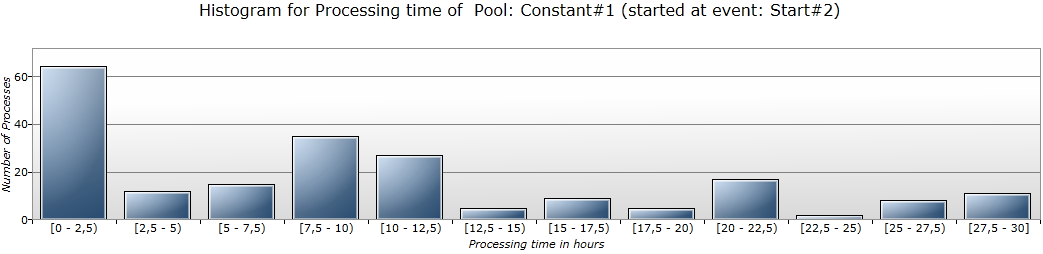
Figure 1: Histogram of the process cycle times
|
|
Figure 2: The process cycle times
|
Explanation
- The trivial answer is: Because the top pool sends a message to the bottom pool.
- Though the answer is right, you might have some trouble accepting it
- And you are right!
- The bottom pool's processing time is not only dependent on the fact, that the upper pool sends a message to it
- It is also important that both pools' start events contain different distributions for their inter-arrival time
- The top pool's start event has a Normal Distribution set with a mean of 1 and a standard deviation of 0.75
- The bottom pool's start event has a Constant Distribution set with a value of 1
- This means that the bottom pool's process instance either has to wait for a message or that the message is already available
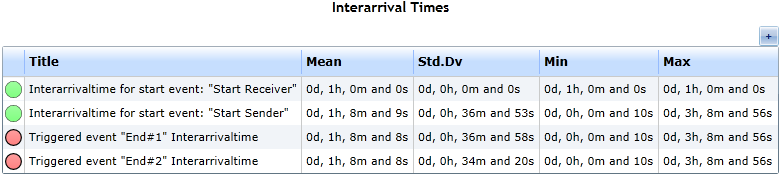
- Have a look at Figure 4, specifically at the inter-arrival time of the start event "Start Sender"
- You will notice, that its mean value is 1 hour, 8 minutes and 9 seconds
- It is slightly higher than the constant inter-arrival time of the bottom pool's start event
- So, the bottom pool's process instances have to wait 8 minutes and 9 seconds for a message receipt (on average)
- This waiting time accumulates to the already known value of the bottom pool's processing time.
|
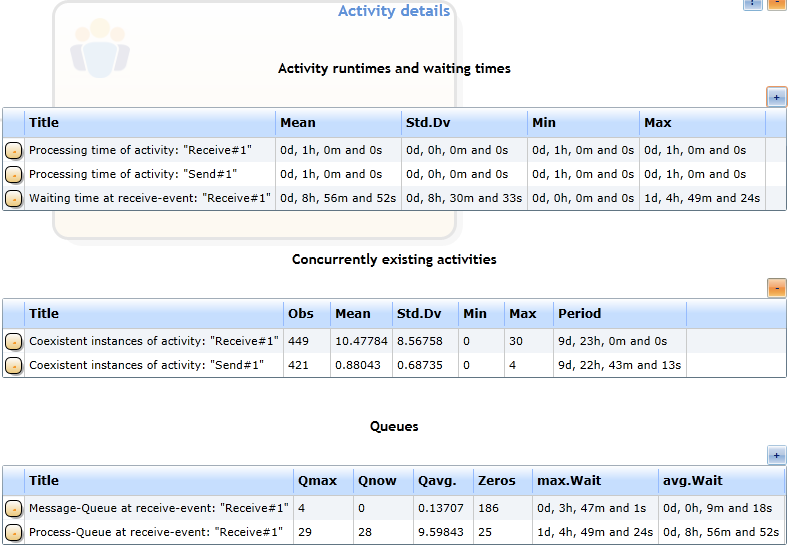
Figure 3: The activity details
|
Queues
- Check out the activities' "Queues" statistics depicted in Figure 3
- You will discover that the message queue (messages waiting to get fetched by any process instance) is under-worked
- There are nor current messages in the queue (Qnow)
- There are 186 Zeros
- The maximum number of waiting elements is 4
- On the contrary the process queue (process instances waiting for a message) is quite busy
- There are currently 28 process instances waiting for a message (Qnow)
- And there are no messages to pick up (see above)
- There almost 10 process instances waiting for message at the same time on average (Qavg)
- There are only 25 Zeros
- These queue statistics help you to prove or disprove your assumptions on the inefficiency of processes
|
Figure 4: The inter-arrival times of events
|