See below for the run configuration, which we set up to receive the report statistics from below.
Please refer to the section Experiment Results for more information on the report specific data.
Run configuration
- Stochastic Seed: 12345
- Simulation start date: 1/1/2014 12:00:00 a.m.
- Simulation stop time: 240
- Simulation stop time unit: Hours
Report
If you take a look at the report, you can see that there is a new category called Resource Details. See Section Report > Gateways & Resources for information on the resource specific report data.
Diagrams
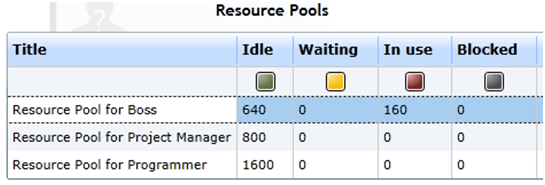
- Figure 1 depicts that the resource Boss was idle for 640 TU and in use for another 160 TU
- This depends on our simulation parameters:
- Simulation time of 26 days, working only on work days and work for 8 hours
- Just do the math:
- 26 days of which 20 days are work days
- and 20 days multiplied with 8 hours work per day equals to 160 total working hours
- The other resources from our Organization Diagram were idle for the whole time because they have not been used in our model
- Further on you can find pie and bar charts in the Resource Details of the report for each resource
- Although numbers are nice, we also offer pie charts which often allow for fast recognition of obvious correlations
|
Figure 1: The report's resource pool statistics of the resource details
|
Queue statistics (advanced)
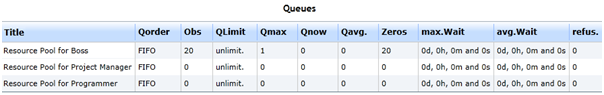
The last part of the Resource Details consists of detailed waiting queue statistics. Every time a process requires one or more resources, the process is queued for the required resource pool. In this example the process is always queued in the pool of the boss role and waits there until the resource is available.
Let us have a look at the statistics depicted Figure 2:
- It is recognizable that a process instance was pulled 20 times from the queue (Obs)
- The maximum queue size was 1 (Qmax)
- which tells us, that there was one process instance waiting at the most and therefore there was no shortage in the provision of the resource
- Additionally there are 20 Zero-Values, which occur when a process instance was queued and instantly pulled from the queue because the resource was available.
- These 20 Zeros conform with the Obs value, because no process instance had to wait for a resource.
- This also manifests in the waiting times (max. Wait and avg. Wait) with a value of 0. Not a single process instance had to wait for a single second until it got its resource needs.
- These four value shows us, that there was no bottleneck in the process (depending on the resources)
|
Figure 2: The report's queue statistics of the resource details
|
Note
If a process needs two different resources, it is queued in both resource pools. Sometimes this results in waiting for one resource, while the other resource is already available. Then the process is dequeued from the available resource and stays in the queue of the unavailable one.